
ProjectLIVE Use Cases
This page is meant to highlight some common, specific use cases that may be applicable to you.
Please note that the suggestions/instructions given for any use case just represents one way / the most efficient way to arrive at your answer, but there may be other ways to do so!
How do I find all publications associated with my organization’s funding?
For a total number:
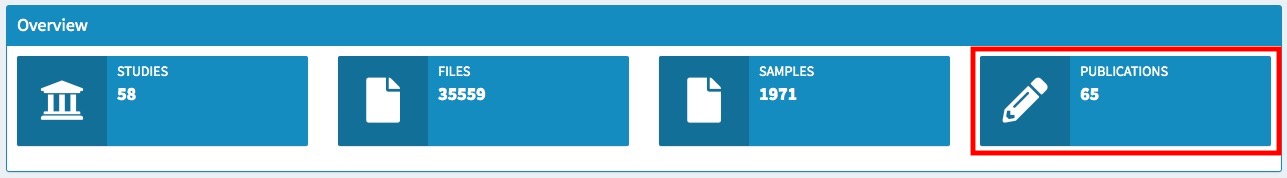
Go to the Snapshot module
Look under the Overview section—you should see here a total number of publications associated with your funding since the beginning.
For a detailed breakdown:
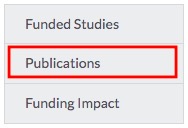
Go to the Publications module
You can use the Publication Status section to see the number of publications per year, per study
Use the Publication Status by Disease Manifestation section to see a similar visualization, but where the publications are displayed by disease manifestation rather than by study
If you hover over any of the colored slices of the plots, you can see how many publications there were for that study in that year, as well as the name of each study.
Want to access the publications themselves? Go to the NF Data Portal and find your organization using the Organizations tab along the top. Then, click Publications on the left.
How can I see if a particular study in my portfolio has uploaded any data?
Go to the Participating Studies module
Select the associated initiative from the dropdown menu
Click the study in the resulting table.
You can also use the search bar to type in the name of the study, and then click on it
Scroll to the Study Timeline section to see a visualization of all files uploaded for this study
See How to use the bar plots for tips on playing around with the visualization to see more details.
How can I see if the files in a particular study have been annotated?
Go to the Participating Studies module
Select the associated initiative from the dropdown menu
Click the study in the resulting table.
You can also use the search bar to type in the name of the study, and then click on it
Scroll to the Annotation Activity section to see a visualization of all files uploaded for this study, whether they have been annotated or not, and who was responsible for the annotation
Double click on Pending Annotation under the Assay legend to isolate only those files that haven’t been annotated. Hover over any of the colored slices to reveal a specific number of files for that year.
See How to use the bar plots for tips on playing around with the visualization to see more details.
How can I tell if data has been annotated for a specific data contributor?
Following the same steps as mentioned in the previous use case, the Annotation Activity visualization will tell you who was responsible for specific annotations. You can see the names listed on the left Y axis of the plots.
Are there any new submissions in the last 30 days?
Go to the New Submissions module
Type 30 Into the Display files uploaded within the last N days field
This will show you all new files uploaded within the last 30 days. You can enter whatever number you wish in the field. Use the Show N entries dropdown to increase the number of files shown on each page, or use the arrows at the bottom of the table to scroll through the pages of entries (if there is more than one page).
How do I track if the studies are uploading data according to their milestones?
Go to the Participating Studies module
Select the associated initiative from the dropdown menu
Click the study in the resulting table.
You can also use the search bar to type in the name of the study, and then click on it
Scroll down to the Milestone or Progress Report tracker section.
Use the Choose parameter to visualize dropdown menu to select either Data Type or File Format as the parameter to visualize in the plots
In the Researcher report progress/milestone update subsection, use the Choose Milestone or Progress Report Number dropdown menu to select the desired number.
The resulting visualization will show you all files expected or annotated with the milestone or progress report number that you chose, compared with the actual number of files.
Hover over any colored slice to see a detailed count.
See How to use the bar plots for tips on playing around with the visualization to see more details.