
Accessing and Reusing Data
Quick Links:
Whether you’re a scientist, a bioinformatician, a data scientist, or a member of the general public looking for data, data on the NF Portal can be explored and accessed in multiple ways. The portal offers helpful filtering tools to help you find data of interest. Much of the data and resources uploaded into the portal are labelled with annotations, so they can be easily used to help query the list of resources in each page. You can find a detailed breakdown of metadata definitions and explanations in our metadata dictionary.
Data Status Definitions
Data Pending: Data has not been uploaded yet to Synapse.
Under Embargo: The project is either in progress or complete, but data is not released. After the grant ends, data contributors typically are provided an embargo period of 12-18 months to publish results. (This varies by funder).
Available: Data that is ready for public use. The data still might have access controls on it due to the sensitivity of data, but otherwise, data can be downloaded.
Data Not Expected: Data that was not originally planned or anticipated in a dataset.
Partially Available: Data for which only some portions are accessible, while others are still being prepared or restricted.
Rolling Release: A continuous and ongoing process of making new data available. An example of this might be a continuous generation of the same type of data collected from cohorts over a period of time.
Is all data equally accessible?
Anyone can browse public content on the NF Data Portal, but you need a Synapse account in order to download data. Register for a Synapse account here. If you’re new to Synapse, you may want to explore our Synapse documentation for more information and instructions.
Some data on the portal is considered controlled use and requires you to request access by reading and electronically agreeing to data-specific terms.
Get started exploring data
In the portal’s Explore tab, the various subtabs correspond to how the data is categorized for your filtering purposes. To demonstrate the best practices for finding data, let’s look at the Files subtab.
Use the image below as a reference as you move through the rest of this page and encounter the different action buttons available. For example, when the search icon (magnifying glass) is mentioned, it will be followed by (1️⃣) to indicate where it is located on the page. Note that buttons found in various places on the page (such as the search icon) will produce the same action, specific to its location on the page.
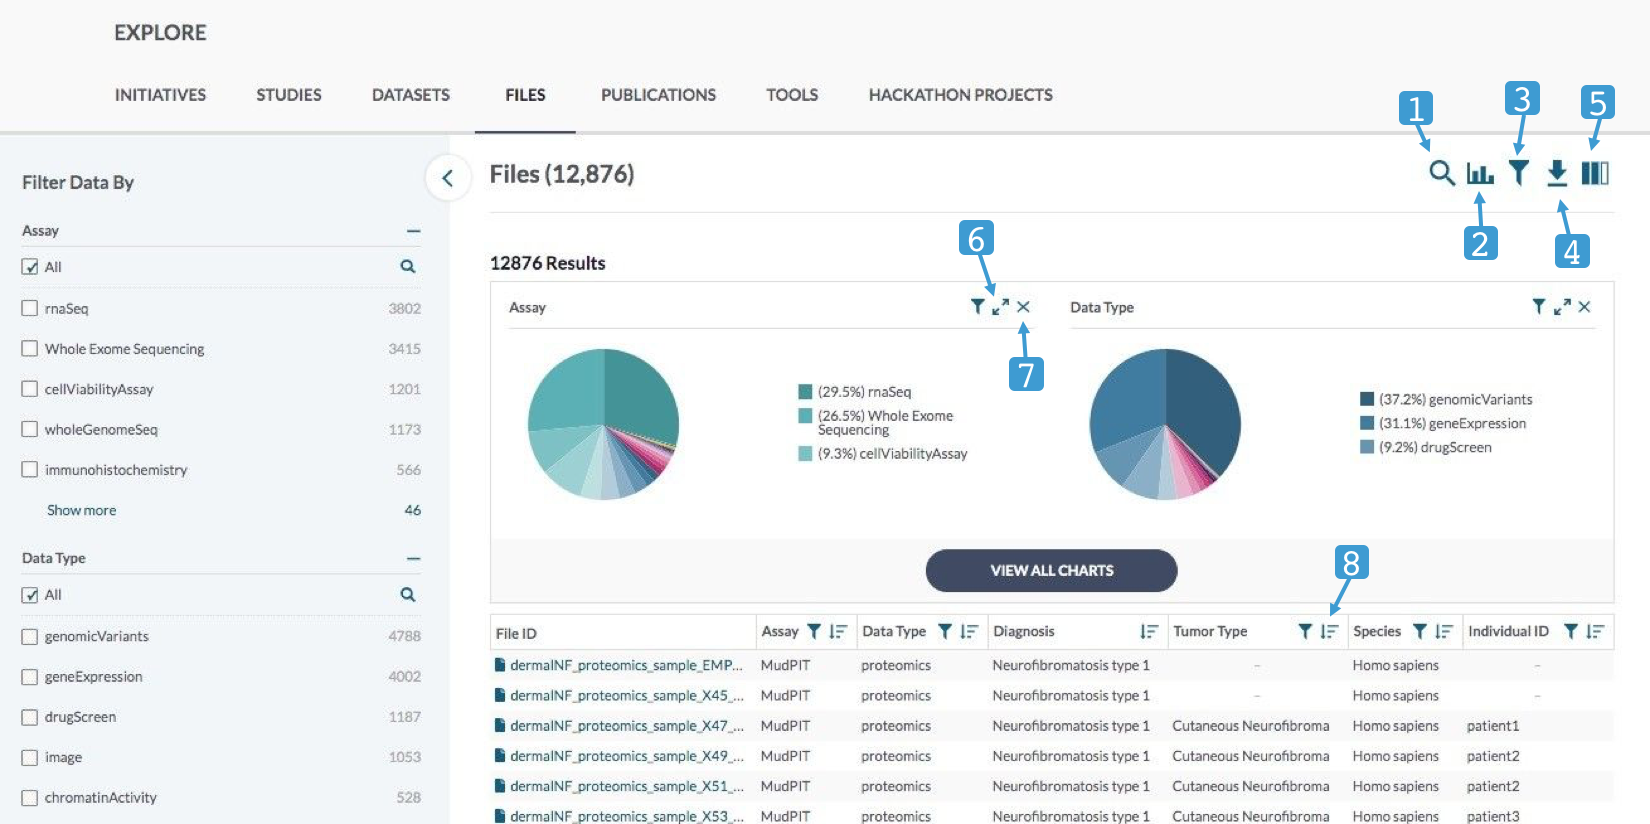
Notice that the page is made up of three sections: visualization charts on top, the data table below, and the filtering tools on the left. There are also a few settings you can use at the top right. Let’s break down each tool on this page, starting with the filtering tools.
![]() Please note: The data and numbers displayed in the screenshot above reflects the portal at that moment in time—this will likely be different than what you see when exploring the portal yourself, since the portal is dynamic and changes as new data is uploaded and processed.
Please note: The data and numbers displayed in the screenshot above reflects the portal at that moment in time—this will likely be different than what you see when exploring the portal yourself, since the portal is dynamic and changes as new data is uploaded and processed.
Filtering tools
Upon landing on the Files subtab, all files that you have permission to view will appear in the table by default (“view” as in seeing the existence of a file, not necessarily having access to download it). In the image shown above, the table and associated graphs incorporate the total of 12,876 files stored (at the time this screenshot was taken). To narrow this data down, use the Filter Data By section on the left.
Filter Data By is broken into sections that will differ depending on the subtab that you’re exploring.
To help explain how to use these sections, refer to the following bullet points and the corresponding image below:
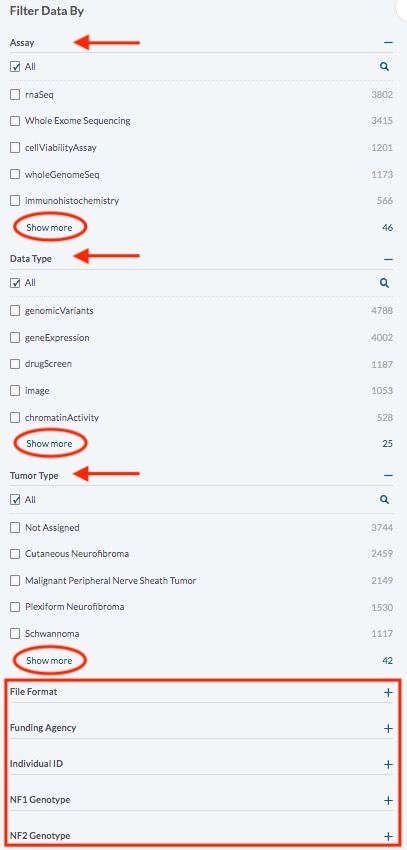
red arrows → When exploring the Files subtab, the Filter Data By sections that appear by default are: Assay, Data Type, and Tumor Type
red rectangle → There are various other categories that you can expand and filter by as well—click the plus sign next to any of these (File Format, Funding Agency, Individual ID, NF1 Genotype, NF2 Genotype, etc.) to reveal its filtering options
red circles → At the end of each category, click on Show more to reveal all filters for that category
search icons → Notice that there is a search icon within each category—use this to search for specific filters within the category
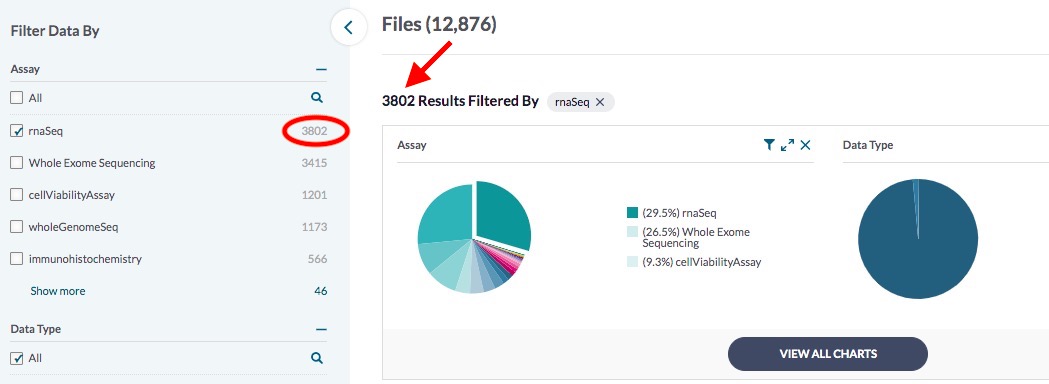
Notice how, by default, each of the categories have a checkmark in the box labelled All. Before you apply any filters for a category, it will include all files within that category until a filter(s) is applied. Next to each filtering option is a number—this indicates how many files will be included once that specific filter is applied. For example, looking at the image above, if you check the rnaSeq box under the Assay section, the files will be narrowed down to 3,802 results, as seen in the image below.
Selecting filters from more than one category will further narrow down the results. For example, if you were to check the geneExpression box from the Data Type section and Schwannoma from the Tumor Type section (in addition to the rnaSeq filter), your results would be narrowed down to 657, as seen in the image below.
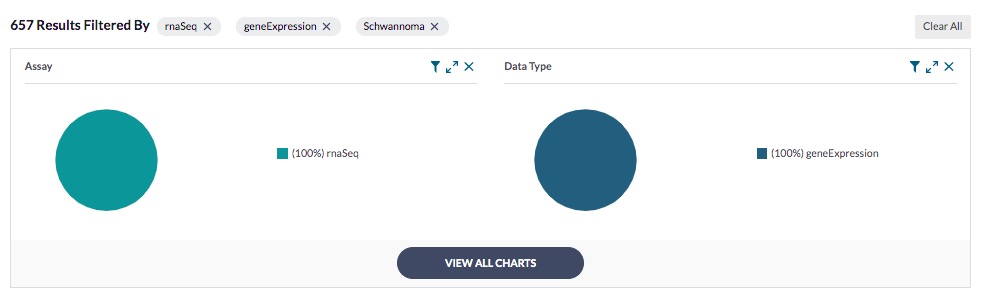
You can play around with the filtering options as you wish to narrow down the search and find your data of interest. Each additional filter will appear in the section under the charts—you can easily remove individual filters as necessary, or click Clear All (top right) to remove all filters and start over.
Visualizations
This section of charts at the top of the page will display visualizations for each category according to the data you’ve filtered. You can use the filter icon (3️⃣) for any chart to adjust the filters for that category—this will change the results as a whole (not just for that chart), just as it would if you changed the filters under Filter Data By.
Use the expand icon (6️⃣) to make that specific chart bigger and the contract icon (inverse of 6️⃣) to return back to normal size.
By default, the charts displayed are for the categories Assay and Data Type. Click VIEW ALL CHARTS to display charts for all categories, and HIDE CHARTS to restore the default display.
Click the X (7️⃣) next to any chart to temporarily remove that chart from view.
Data table
The data that you’ve filtered for will appear in the data table below the visualizations section. Notice how it’s organized by category—you can use the filter icon (3️⃣) next to any category header to change the filters, just as it would if you changed the filters under Filter Data By. Use the reorder icon (8️⃣) next to any of the category headers to rearrange the table data in reverse based on that category.
Use the horizontal scroll bar below the table to reveal extra category columns.
The table will only fit 25 rows of data—click Next or Previous to shuffle through more rows as needed.
Additional settings
At the top of the page, above the visualization section, there are several icons you can use to adjust the page settings.
The search icon (1️⃣) allows you to search for specific terms to filter for instead of going through all the categories in the Filter Data By section. You can select a certain category to search within. Click the icon again to hide the search bar.
The graph icon (2️⃣) allows you to hide/show the Visualizations section.
The filter icon (3️⃣) allows you to hide/show the Filter Data By section.
The download icon (4️⃣) allows you to export the currently displayed table in .csv or .tsv format. To do so, click Export Table, select your settings, click Next, and finally click Download once the prompt indicates your file is ready. From the download icon, you can click Add to Download List to save the table to a list for later. You also have the option to click Programmatic Options, which allows you to download the table via the Synapse command line client.
Finally, the columns icon (5️⃣) allows you to customize the table by adding or removing specific columns.
Data Exploration Tips: Here are a few tips to help make the most of your data exploration:
When using the search function, type exact terms—unlike Google or other search engines, our search function requires exact matches in order to find terms (it may not return accurate results for misspelled or incomplete terms)
For a high-level view of the kinds of data available in the portal, browse the visualizations (mentioned earlier on this page) that are located on every Explore page.
Most initiatives, studies, publications, hackathons, and organizations have associated detail pages where you can drill down into its associated details and related data. For example, if you visit the Children’s Tumor Foundation detail page, you can view all of its associated studies, data, and publications.
Downloading data
You can download data from the Synapse web interface, which has a maximum download size of 5 GB or 100 files. Find instructions on how to download files from the web here.
Alternatively, you can download data using programmatic clients (Python, R, and command line). This method requires some technical knowledge, but you can learn the basic commands to do this in Synapse Docs. Find instructions on how to download files programmatically here.
Accessing data with Access Restrictions
For a walkthrough of how to access data that has access restrictions, see this guide which uses The Johns Hopkins Biospecimen Repository data as an example.